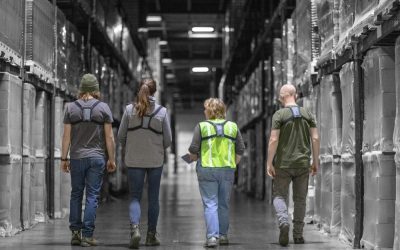
IoT analytics and millions of hours of safety data boiled down into one easy-to-use interface
The SafeWork Dashboard is the key to an optimized workflow and a workforce galvanized around a central safety culture. IoT analytics and millions of hours of safety data are boiled down into one easy-to-use interface, giving facility managers and business stakeholders access to individualized safety metrics, customized reports, industry benchmarking and so much more, all from their laptop, phone, or tablet.
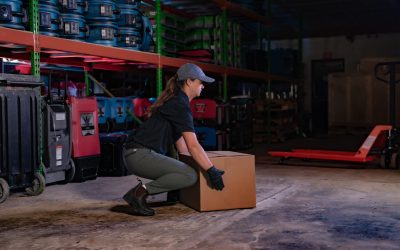
The data that our sensors collect in your facility is analyzed by our AI analytics system to detect troubling trends so we can provide solutions, ranging from simple health and safety tips such as proper lifting technique to operational risk engineering that can help your team mitigate these repetitive dangerous movements. The Dashboard is how you can access this information, conveyed in various reports that make it clear where action and intervention is needed.
If our safety wearables are the hands of the SafeWork System, working on the front lines to mitigate risk and collect data, the dashboard is the brain, collecting and analyzing the millions of hours of data in a comprehensible way that delivers actionable insights and simple solutions. In short, the SafeWork Dashboard is your portal to injury reduction, facility enhancements and a healthier bottom-line.

Features
Single Source. Your simple, single source for workplace risk management and proactive safety interventions. All the information you could ask for – a world of safety analytics and insights – at your fingertips.
Ready Reporting. Always-on safety insights give a comprehensive look at your facility’s safety level. See facility-wide trends as well as individual Industrial Athlete metrics to develop a full understanding of potential risks.
Industry Benchmarking. Measure your safety metrics against competitors and others within your industry. Compare your facilities and ensure each facility ranks among the best of the best.
Tailored Integrations. Smoothly transition an end-to-end risk management system into your operation with our individualized approach. Data from the SafeWork System plugs seamlessly into existing HR, project management, training software and more.
Operational Optimization. Proactive safety and workforce data transforms the way you operate from the ground up. See how, when, and where risks exist so you can prevent injuries before they can occur.
Support Page. Help Desk provides quick answers to help you get the most out of your SafeWork System. Easy access to our support team through the SafeWork Dashboard if you require assistance – we’re eager to help.

Reporting
Improve behavior and drive safety culture deep within your organization with actionable, always-on reporting across a wide spectrum of risk factors with insight tailored for every level, from the warehouse floor to the executive office.
The SafeWork Dashboard has three levels of tiers, progressively offering more complete coverage of your organization so you receive a safety platform tailored to your needs. The following reports are customized for your facility, and can be accessed depending on the level of your SafePlace plan.
Tiered Report Options Include:
Industrial Athlete Insights. Prioritize safety and elevate awareness of at-risk behavior through real-time feedback and individual Safety Scores delivered straight to the Industrial Athlete.
Supervisor Shift Report. Daily access to the latest metrics on at-risk team members with insight for meaningful interventions improving behavior and preventing injury.
Program Impact & Analysis. Detailed ergonomic insights including minute by minute risk factor readings, time of day analysis, job function comparisons and facility-wide understanding.
Tenure & New Hire Report. Safety data broken down based upon tenure. Learn about trends relating to experience level and determine if your onboarding process is effective.
Workplace Risk Mapping. A virtual map composed of specialized safety data from your facility; learn where, when, and how risks exist in your workplace so you can prevent injuries before they can occur.
Organizational Analysis. Track the progress of your program and compare facilities, job-types and more while evaluating your organization goals. Easily identify important trends across facilities, regions or teams.
To learn more about the SafeWork Dashboard and how it integrates into the SafeWork System, read more on our blog or request a trial today.


